
The Dashboard Design Playbook: From Sketch to Screen
A simple way to design better Tableau dashboards (without rework)
Most dashboards don’t fail because of bad data; they fail because we start building too soon. We open Tableau, drag a few charts, add filters, and hope it all comes together, but it ususally doesn’t. Here’s a simpler, more effective approach I use in real projects:
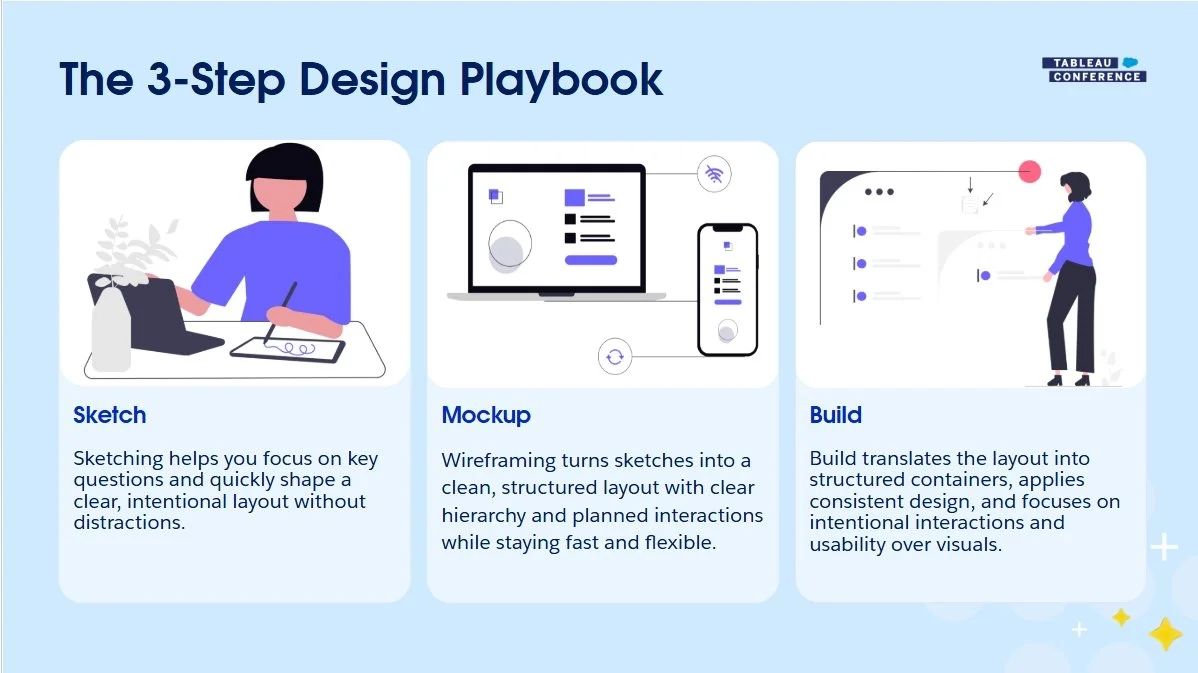
Sketch → Wireframe → Build
This three-step playbook helps you move from chaos to clarity much faster.

The scenario
Let’s say you’re working with a growing brewery: Hoppy Trails Brewing Co.
They have plenty of data:
Customers
Products
Geography
Orders
Revenue & Profit
But leadership doesn’t want more data, they want a clear way to answer their key questions.
Typical ask:
“Can you build me a dashboard?”
A dashboard provides accessible answers to these common questions about the data:
How are we performing?
What’s driving results?
Which products are working?
Where should we dig deeper?
That’s your starting point. Not Tableau!
Where dashboards go wrong
Most people:
Start directly in Tableau
Build without structure
Iterate endlessly
End up with busy dashboards that don’t answer questions
The dashboards aren’t ending up busy because of a design flaw. They need a better design process.
My way: the 3-step design playbook
So what’s the better way?
Instead of jumping straight into Tableau, I follow a simple 3-step process:
Sketch → Wireframe → Build
The goal is not to slow the project down. The goal is to make the build faster, clearer, and less painful. Sketching helps you think through the idea. Wireframing helps you structure and align with stakeholders.
Building in Tableau becomes the final execution step, not the place where all design decisions happen.
In other words:
Design first
Build second
Rework less
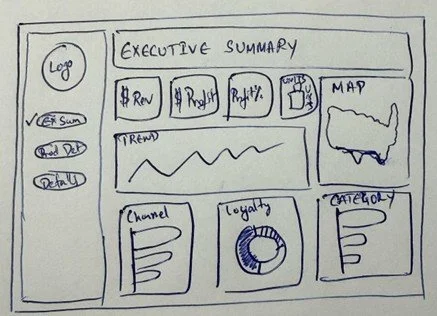
Step 1: Sketch
Sketching is the fastest way to design a dashboard.
Focus on:
What matters most
What goes where
How users will read the dashboard
Why it works:
Forces prioritization
Keeps focus on questions
Makes feedback easy
Prevents overdesigning early
A 10-minute sketch can reduce long workarounds later.
Step 2: Wireframe
Now take the sketch and clean it up.
Use Figma (or any tool) to create a layout.
Remember: this is not a dashboard. But it does give you a plan to build your dashboard from the ground up.
Define:
Layout and sections
Hierarchy (what stands out first)
Spacing and alignment
Filters and interactions
Why this step matters:
Faster to iterate than Tableau
Easier stakeholder alignment
Reduces rework later
Remember: Incorporate feedback early
Example changes:
Add revenue vs profit toggle
Add region filter
Break down by category
These changes take minutes in a wireframe, but they take much longer in Tableau.
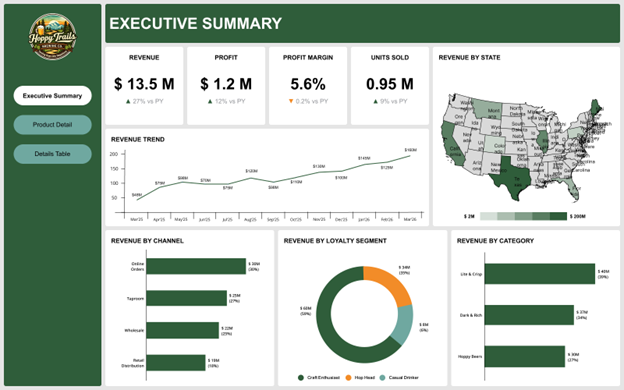
Step 3: Build (Now open Tableau)
Now you build with the clarity of your wireframe. The guesswork has been eliminated, and you now have a clearer vision of all the pieces you need to incorporate into your dashboard.
Focus on:
Clean container structure
Consistent spacing
Clear hierarchy
Intentional interactions
Link to Hoppy Trails Dashboard
Tableau becomes faster when thinking is already done.
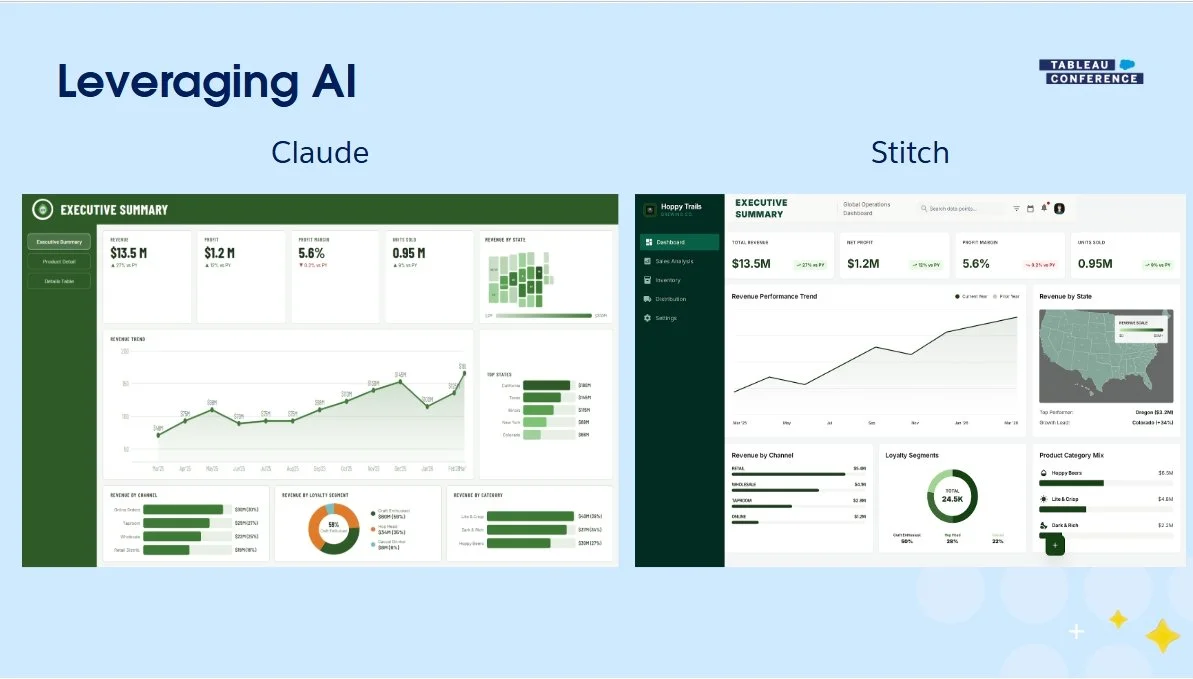
Where AI Fits
AI can help with:
Quick layout ideas
Mockups
Inspiration
But it doesn’t replace:
Business understanding
Prioritization
Design decisions & elements
Use it as a helper, not a replacement.
Don’t start in Tableau
1. Sketch first
2. Wireframe to align
3. Get feedback early
4. Build with intention
By changing the process, you can create better dashboards faster and with less rework.
Final Thoughts
Great dashboards are like great beer. Balanced. Clear. Easy to enjoy. Not overloaded. So next time someone says: “Can you build me a dashboard?” Don’t open Tableau. Start with a pen.