

Eigen X + Tableau
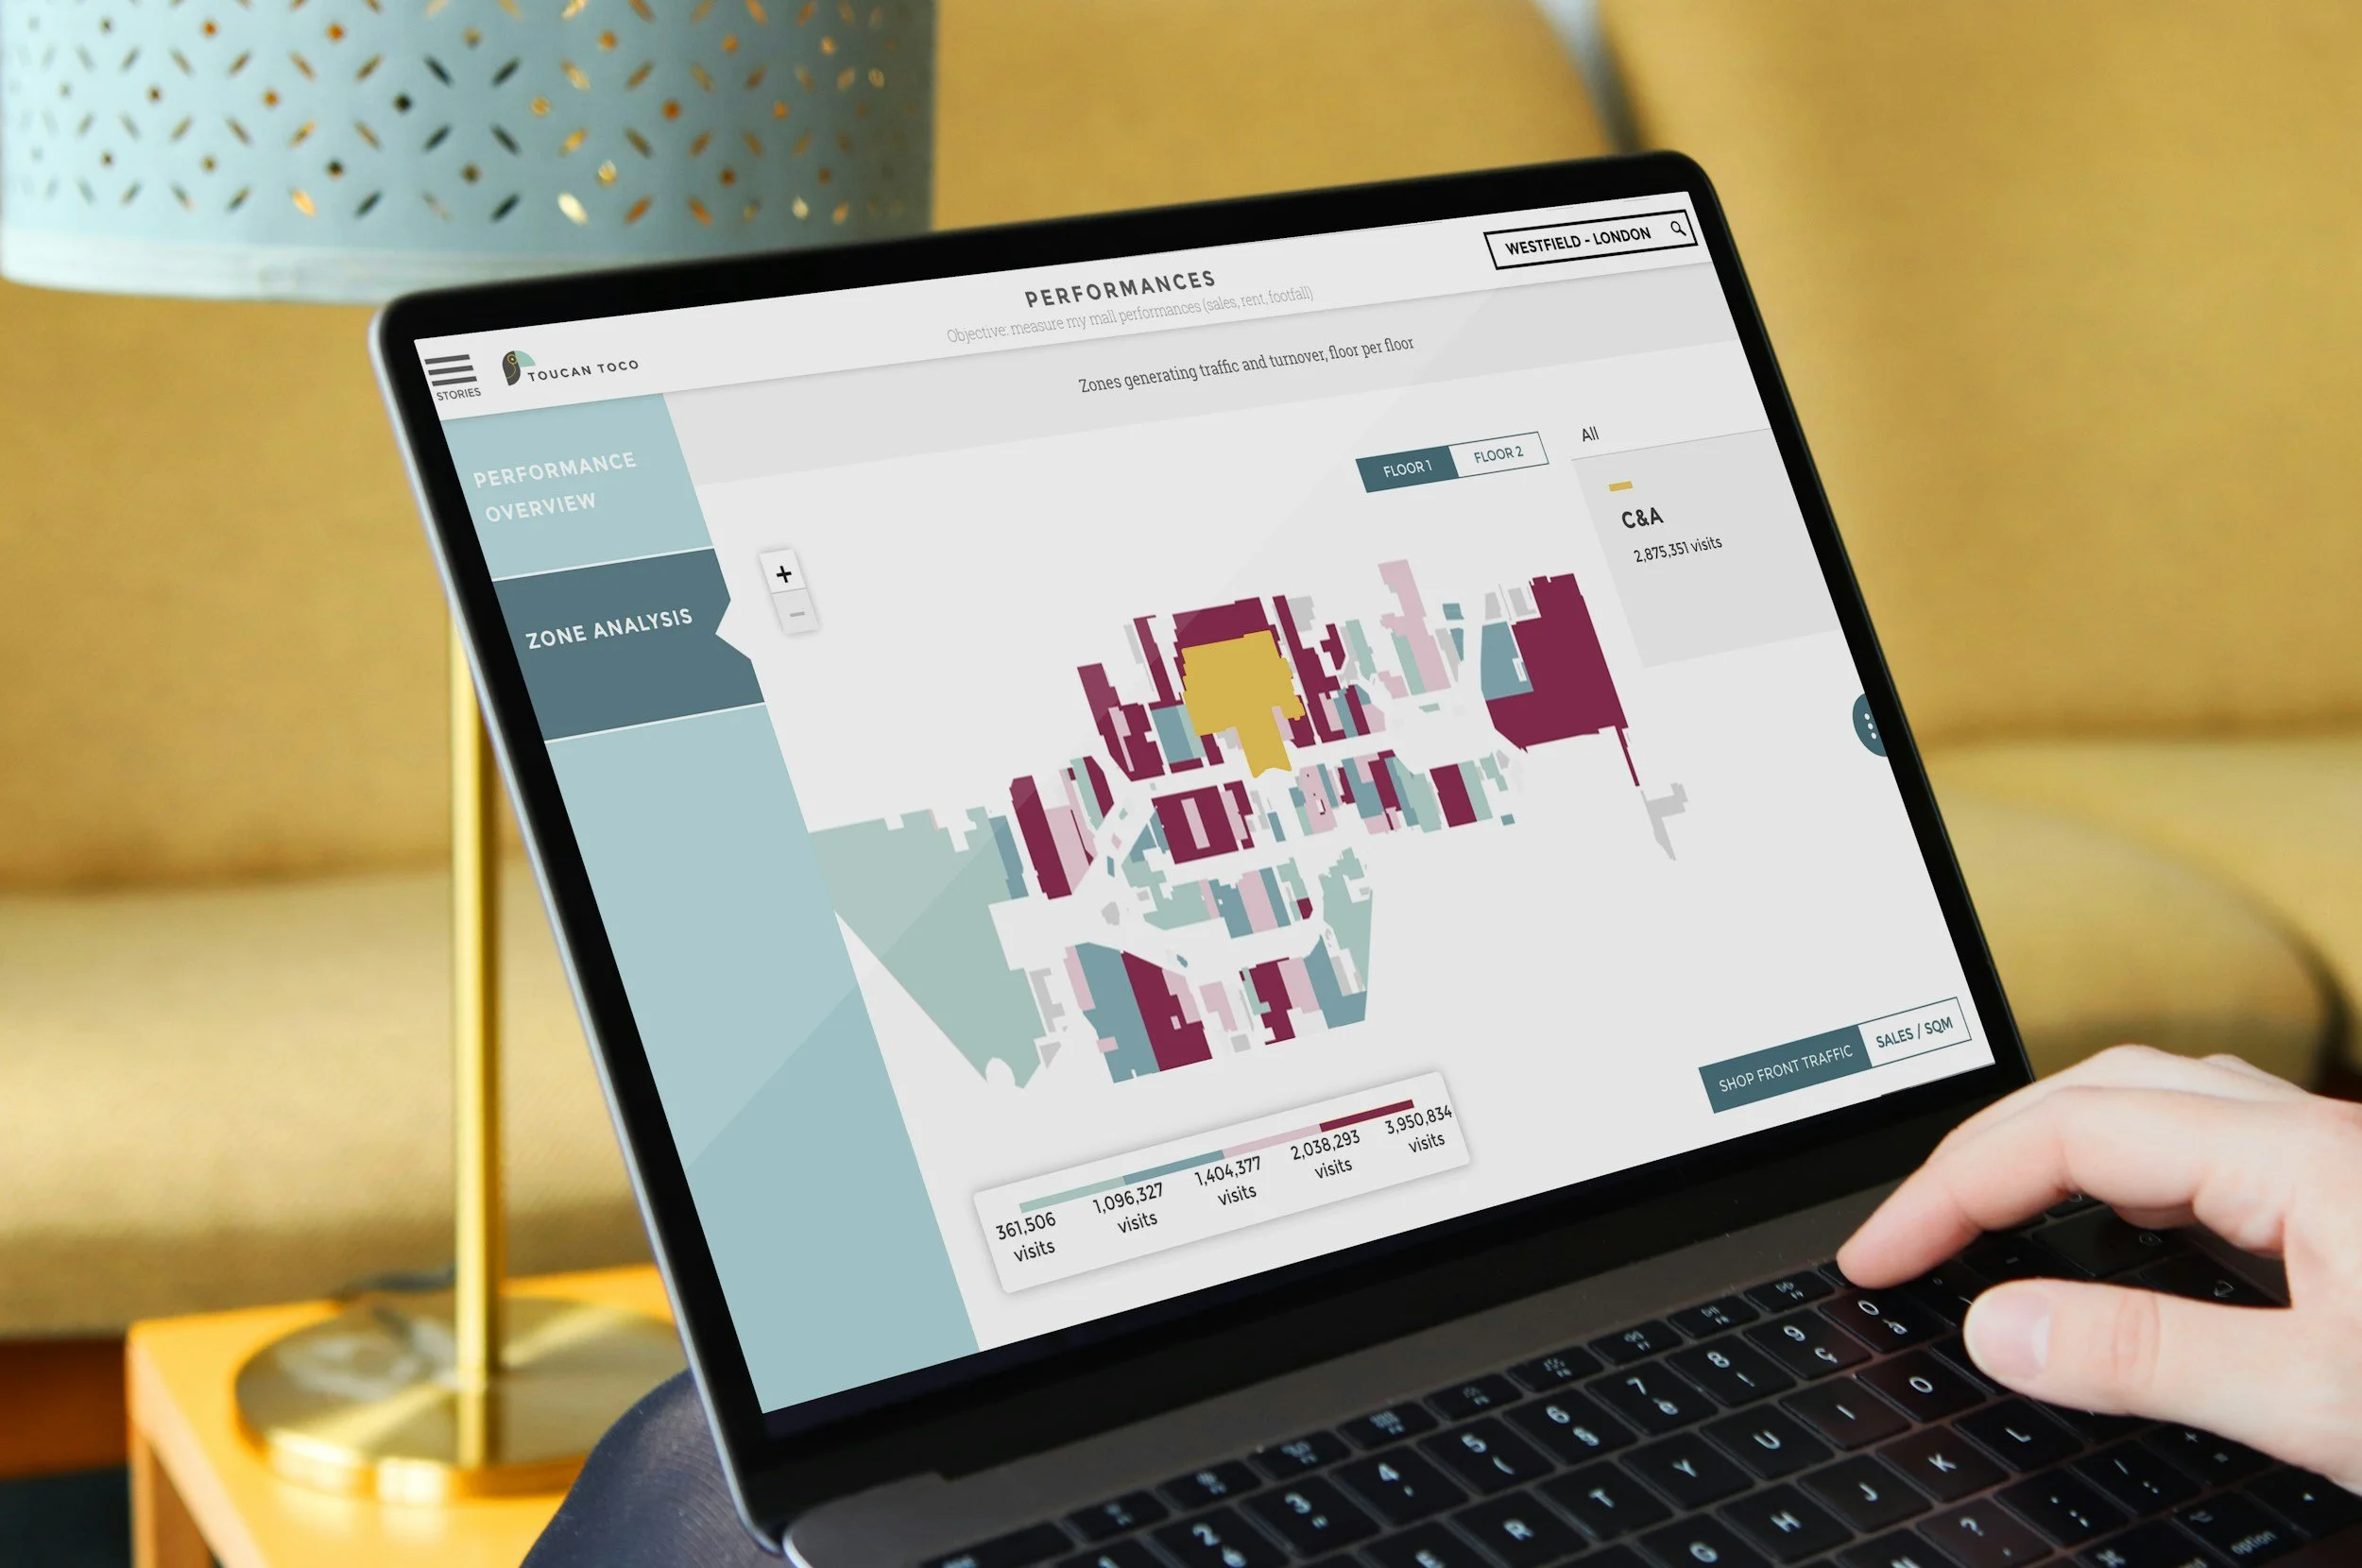
Experts in Data Visualization
Our experienced team will make your reporting accessible, consumable, and repeatable. We can step into any phase of the BI Development life cycle from prototyping to deployment to adoption. Using leading best practices in data visualization we design each dashboard specifically for the intended audience, displaying metrics that are relevant to your company’s objectives. Keeping it simple and intuitive we create at-a-glance, interactive visualizations of your most current data and make it widely available as a self-service solution to all relevant stakeholders.
-
![]()
Tableau Premier Services Partner
-
![]()
Certified Tableau Consulutant
-
![]()
Certified Tableau Architect
-
![]()
Certified Tableau Desktop Specialist
-
![]()
Certified Tableau Data Analyst
-
![]()
Tableau Next Implementation Expert


Why Tableau?
Tableau is the most powerful, secure, and flexible end-to-end analytics platform for your data. As the leader in the Business Intelligence industry, Tableau offers quick and interactive visualizations with built-in AI insights powered by Agentforce. With simple drag-and-drop-features it allows you to instantaneously analyze key data and share crucial insights.
》
Acquire Data & Prep
Easily consolidate data from multiple sources
Full data load automation
Prepare and cleanse data with Tableau Prep and Conductor
》
Visualize & Explore
Use powerful drag-and-drop analytics with Tableau Desktop
Tell a story with a dashboard
Quickly develop better data visualizations
》
Publish & Share
Publish dashboards on a schedule
Share data and insights with Tableau Server and Tableau Online
》
Collaborate
Large online community
Dedicated to releasing new versions and features
Extensions available to give customers new, extended functionality
A Valued Partnership
As one of Philadelphia’s leading Tableau partners since 2015, Eigen X has successfully implemented Tableau as a visual reporting solution across a variety of industries. By leveraging the power of our relationship with Tableau, our certified developers can guide you through best practices, and can address and expedite issues with access to Tableau resources and solutions engineers.
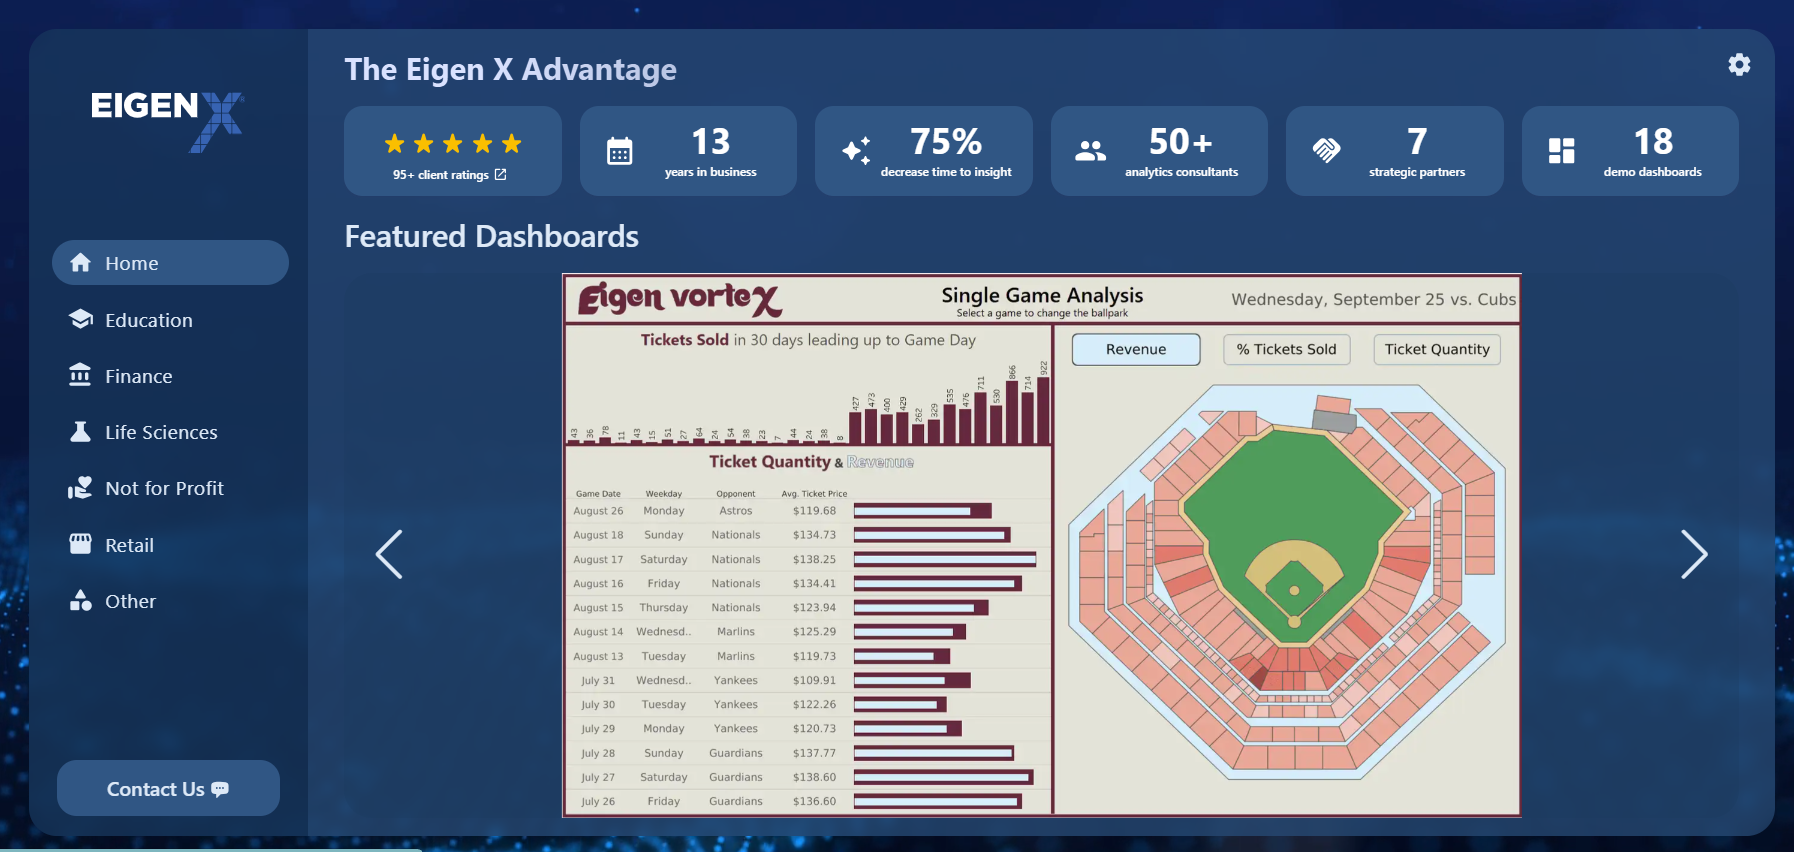
Check Out Our Data Viz Gallery!
Showcasing our expertise in Tableau and Power BI, this portal highlights the impactful work we do at Eigen X! Our data visualizations are customized to your unique needs, regardless of industry or data size, turning complex spreadsheets into meaningful insights.
Key Tableau Offerings
-
Our team evaluates your current BI landscape, identifies gaps in data access, governance, and adoption, and creates a practical roadmap for Tableau implementation or modernization. Whether you are standing up Tableau for the first time, expanding Tableau Cloud, or preparing for Tableau Next, we focus on building an analytics strategy tailored to your business needs. Tableau’s product portfolio is designed to help teams move from data to insights to action across Desktop, Server, Cloud, and Tableau Next.
-
We design the data pipelines, preparation workflows, and governance structures that make analytics reliable, secure, and easy to use. Our approach includes connecting data from multiple systems, preparing and cleansing data for analysis, automating refreshes, and establishing trusted sources that business users can explore with confidence.
-
Our dashboard development process combines visualization best practices, stakeholder feedback, and iterative delivery so the final solution gives your business the insight it needs to make everyday decisions. From executive dashboards to operational reporting, we create analytics experiences that are clear, interactive, and designed for adoption.
-
We support Tableau across deployment models, including Tableau Cloud, Tableau Server, and emerging Tableau Next capabilities. Our team helps configure secure environments, migrate from legacy deployments, optimize performance, and align your Tableau architecture with Salesforce, Data Cloud, Snowflake, and other enterprise data platforms. For organizations exploring Tableau Next, we can help define use cases, develop proof-of-concepts, and plan a future-state analytics environment that uses semantic models, AI-driven insights, and embedded analytics in the flow of work.
-
With Tableau Pulse, Tableau Agent, Tableau Next, and Salesforce-native integrations, we can help surface proactive insights, enable natural language exploration, and embed analytics into the tools where teams already work. This gives users faster access to the “why” behind the numbers and helps organizations respond to changes before opportunities are missed.
-
We partner with teams to build confidence, increase adoption, and establish repeatable analytics practices. Our support can include training, stakeholder enablement, governance models, health checks, managed services, and ongoing optimization. The goal is to help your organization create a sustainable analytics culture where users trust the data, understand the dashboards, and know how to turn insights into better decisions.
Philadelphia Tableau User Group

The Philadelphia Tableau User Group unites data enthusiasts of all levels to learn, share, and connect through workshops, talks, and collaboration. At the 2026 Tableau Conference, we were voted TUG of the year!
Tableau Training for Your Group
Get your team up to speed quickly with live instructor-led training. We offer small group classes in Tableau Prep and Tableau Desktop. Any course can be tailored to your needs with the option of using your own data. We can even fully customize a curriculum just for you!
Intro to Tableau Prep
In this 1-day course your team will learn the fundamentals of ETL, exploring, shaping, cleaning, and joining data using Tableau Prep.
-
One of the most important pieces for Tableau Desktop is the data. This course will help you Extract data from multiple sources, Transform (cleaning, shaping and joining, among other things) and Load the data for Tableau Desktop usage. Building your first ETL can be a bit intimidating, but with this introduction to Tableau Prep, you will be transforming multiple input sources to a Desktop-ready data source in no time! Topics include bringing in data from multiple sources, joining the data, cleaning and shaping the data as well as producing output for Tableau Desktop.
The course content uses the Superstore dataset that is built into Tableau Desktop. Alternatively, we can deliver the training and exercises using your company’s own data.
-
(Specific topics or areas of focus can be customized to your needs)
Data Flows
Connecting to Data
Exploring Data
Shaping Data
Combining Data
Cleaning Data
Joining Data
Unions
Save and Share Data
Best Practices
Tableau Desktop Essentials
This 2-day course covers beginner and intermediate topics in Tableau Desktop. It is a great foundation course for any Tableau Desktop user.
-
In this foundational Tableau Desktop course you will learn all the basics needed to get started designing visualizations and dashboards. It’s a great kick-start for absolute beginners, but also valuable for those with some experience looking to get a better handle on tough concepts such as Continuous vs Discrete data, LOD expressions and knowing when to use the right chart type. The course culminates with participants creating a simple dashboard.
The course content uses the Superstore dataset that is built into Tableau Desktop. Alternatively, we can deliver the training and exercises using your company’s own data.
-
Day 1: Beginner
Connecting to Data
Data Types
Organizing and Configuring Your Data
Tableau Worksheet Interface
Dimensions & Measures
Continuous vs Discrete
Relationships between Numerical Values
Sorting Data
Building Charts:
Pie Chart, Line Chart, Bar Chart, Stacked Bar Chart, Dual Axis Chart, Table, Scatter Plot, Treemap, Bubble Chart, Map
Editing & Customizing Data
Day 2: Intermediate
Multiple Measures in a View
Quick Table Calculations
Data Source Filters
Tableau Calculations: Basic
Tableau Calculations: LOD Expressions
Mapping Data Geographically
Reference Lines
Parameters
KPIs
Dashboards
Extracts & Refreshes
Publishing & Sharing
Tableau Desktop Dashboard Design
This 1-day course will equip you with visual analytics best practices. Level up your skills by learning all the tips and tricks required to make your dashboards clean & effective.
-
Go beyond this basics with this 1-day Dashboard Design course. Our instructor will take you through the end-to-end dashboarding process from conceptualizing the layout, to creating the visualizations and constructing the dashboard like a pro! You will learn many valuable tips and tricks for making your final dashboard look as polished and professional as possible. This is a great follow-up course to Tableau Desktop: Essentials.
The course content uses the Superstore dataset that is built into Tableau Desktop. Alternatively, we can deliver the training and exercises using your company’s own data.
-
Approaches to Dashboarding
Data Considerations
Design Layout
Formatting Worksheets
Dashboard Objects
Layout Containers
Dashboard Formatting
Quick Filters and Action Filters
Finishing Touches
Dashboard Best Practices
Tableau Post-Training Support
You can add a Tableau support contract onto any Training course to help bridge the gap between training and pro status. This is a great way to ensure your team applies what they have learned!
-
Tableau Training is a great way to get your team up to speed with essential design skills. However, cross-functional teams, or individuals of varying skill levels will likely benefit from more specialized coaching to put the skills they have learned into practice.
Our Tableau Post-Training Support program is an add-on option that enables our instructors to stay involved with learners post-training, and to coach them in best practices for success in their specific areas. For example, some learners may need help with more complex calculations, more advanced chart types, or may be looking for recommendations on the best way to approach a specific reporting/visualization challenge that they are facing. Our team can give them personalized guidance to set them on the right course for long-term success.
You’ve already made a great learning investment in your team. Now it’s time to make it stick!
-
Although you can opt for any amount of support, most clients sign up for a block of 20+ hours. We will provide 1 talented trainer or Tableau specialist dedicated to your account who will interact directly with your team members via your preferred mode of communication such as phone/video conference or email.
Request a Customized Tableau Course
Don’t see what you’re looking for? Need something more tailored or specialized? We can create training for any Tableau topic!
-
You get to decide!
-
You get to decide!