Analytics Capabilities
Data Visualization
Communicate insights quickly and effectively
Effective data visualization is the result of a thoughtful, repeatable process, not just well-designed dashboards. Organizations often face challenges with inconsistent data, manual preparation, and reporting solutions that don’t align with how decisions are made.
Eigen X delivers end-to-end data visualization services that follow a clear analytics lifecycle, starting with data preparation and modeling, moving through requirements definition and design, and culminating in deployment and user adoption. We work closely with business and technical stakeholders to ensure each step is aligned to business goals, resulting in intuitive, trusted visualizations that enable faster, more confident decision-making.
Related Offerings
-
Data Preparation & Modeling
We start by understanding your data sources and business requirements, then cleanse, transform, and model data to create a reliable analytical layer.
-
Dashboarding & Reporting Design
Through collaborative requirements gathering and iterative design, we develop dashboards and reports that reflect how users consume information and support real-world decision-making.
-
Visualization Configuration & Implementation
We implement and configure visualization platforms to support performance, security, and scalability, ensuring seamless integration with your existing data and analytics architecture.
-
Deployment, Enablement, & Adoption
We deploy solutions with appropriate access controls and governance, and support adoption through documentation, training, and continuous improvement as business needs evolve.
Technologies We Use
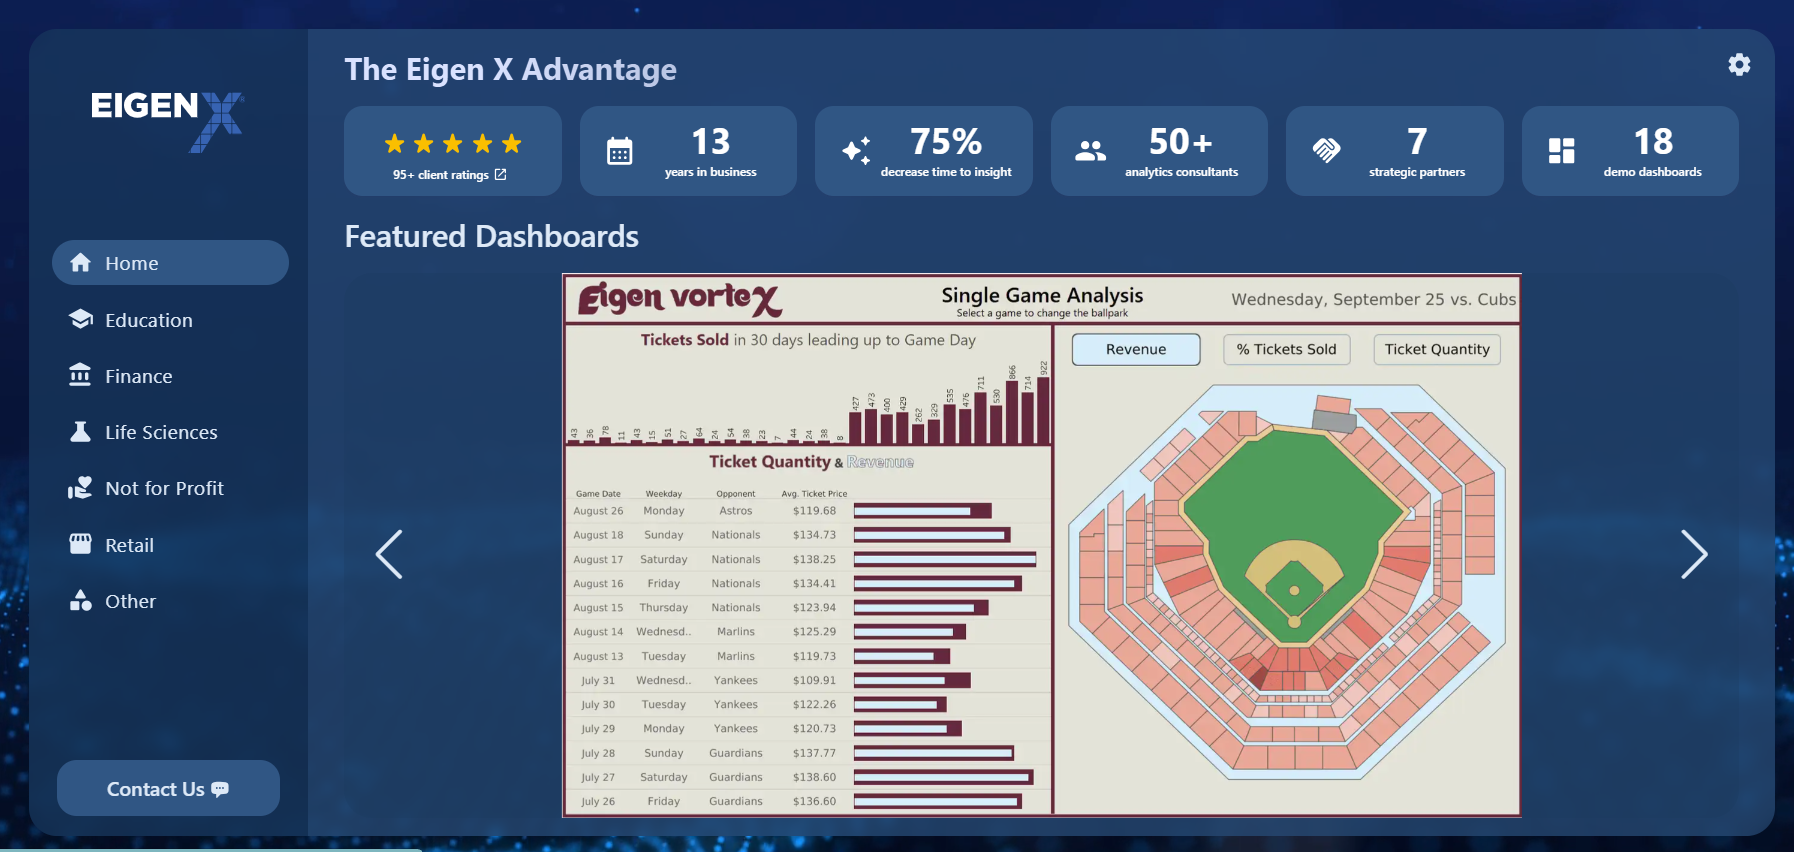
Check Out of Data Viz Gallery!
Showcasing our expertise in Tableau and Power BI, this portal highlights the impactful work we do at Eigen X! Our data visualizations are customized to your unique needs, regardless of industry or data size, turning complex spreadsheets into meaningful insights.